Ever wonder if there is a faster way to sift through data in Excel?

Perform your day to day analysis faster.. so you can go home early!

Do you want to work more efficiently?

You're a corporate worker, often raking through many data files transmitted to you. You get spreadsheets after spreadsheets containing tons of data and you wonder, there must be an easier way to analyze this?

You're a student or a researcher, working through many sample data or lab results. You painstakingly group your data manually and create numerous charts, constantly re-arranging your data to get some insights. 

... Or you are just someone curious about learning how to simply handle and analyse data for your business.


Does this sound like you?


What If..

  • You already knew Pivot Tables could analyse most of the things that you want automatically?

  • You can already manipulate the data from various angles easily to uncover insights and discover trends that can lead to a breakthrough in YOUR research?

  • You can already skip through scouring all over the internet in hope of finding all things related to Pivot Tables - and learn it all in one place?

  • You already have that extra skill and expertise in using Excel that can set you apart from others? Not to mention, go home early because you're so awesome at your job?

Meet Pivot Table..

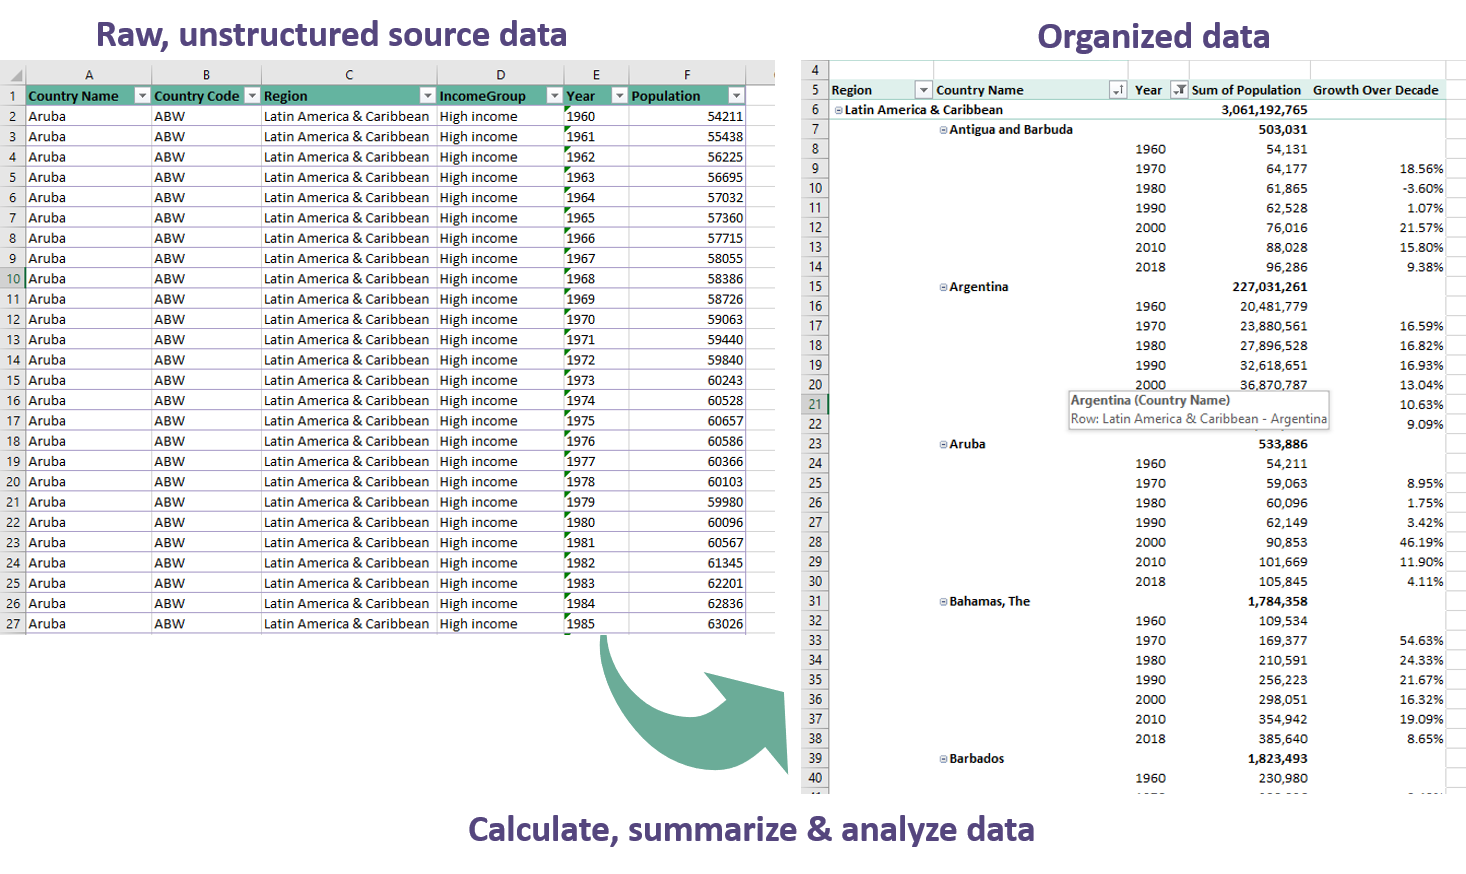
PivotTable is one of the most important and powerful tools available in Excel to calculate, summarize, and analyze data quickly. It allows you to see comparisons, patterns, and trends in your data in seconds! Without having to do calculations manually!

Want to know more?

Get to know Pivot Tables better

Course curriculum

  • 1

    1. Introduction

  • 2

    2. Creating your First Pivot Table

  • 3

    3. Formatting your Pivot Table

  • 4

    4. Sorting, Filtering & Grouping

  • 5

    5. Calculated Values & Fields

  • 6

    6. Charts & Visualizations

  • 7

    7. Additional Info - Personal Expenses Dataset

  • 8

    8. Closing

  • 9

    Bonus #1! Creating Personal Expenses Dashboard

  • 10

    Bonus #2!

but hold on.. there is a Bonus!

With this purchase TODAY, you get access to additional contents!

  • Bonus #1

    Learn how to create your own Personal Expenses Dashboard! Includes lessons on how to use the TEXT and IF excel formulas to create dynamic chart titles

  • Bonus #2

    Learn how to use Power Query to transform and restructure your source data

So.. Here's What You're Getting

  • Approximately 50 videos worth of lessons on Pivot Tables, making up to almost 5 hours of knowledge, that you can go at your own pace

  • Little snippets of Excel tips and shortcuts throughout the course to help you become more efficient in Excel

  • Your own Personal Expenses Dashboard

  • A quick introduction to Power Query

Course Instructor